Project data
For the workshop, we will be using a greatly reduced dataset from the Wetland Intervention Monitoring Projects (WIMP; thanks Kay Morris 👏).
Each day we will provide a Rstudio project that will have the data as well. If you want to start from scratch, click on link below to download project data files and go from there.
Project overview
Purpose
Goal: Improve grazing management
Question: How does grazing intensity affect wetland plants?
Framework: The ecological framework underpinning this study is the Intermediate Disturbance Hypothesis.
Grazing treatment: Here, we focus on two types of grazing: Press (low intensity for longer) and Crash (high intensity for shorter).
Show code
cowplot::ggdraw() + cowplot::draw_image('images/dataset/idh.PNG')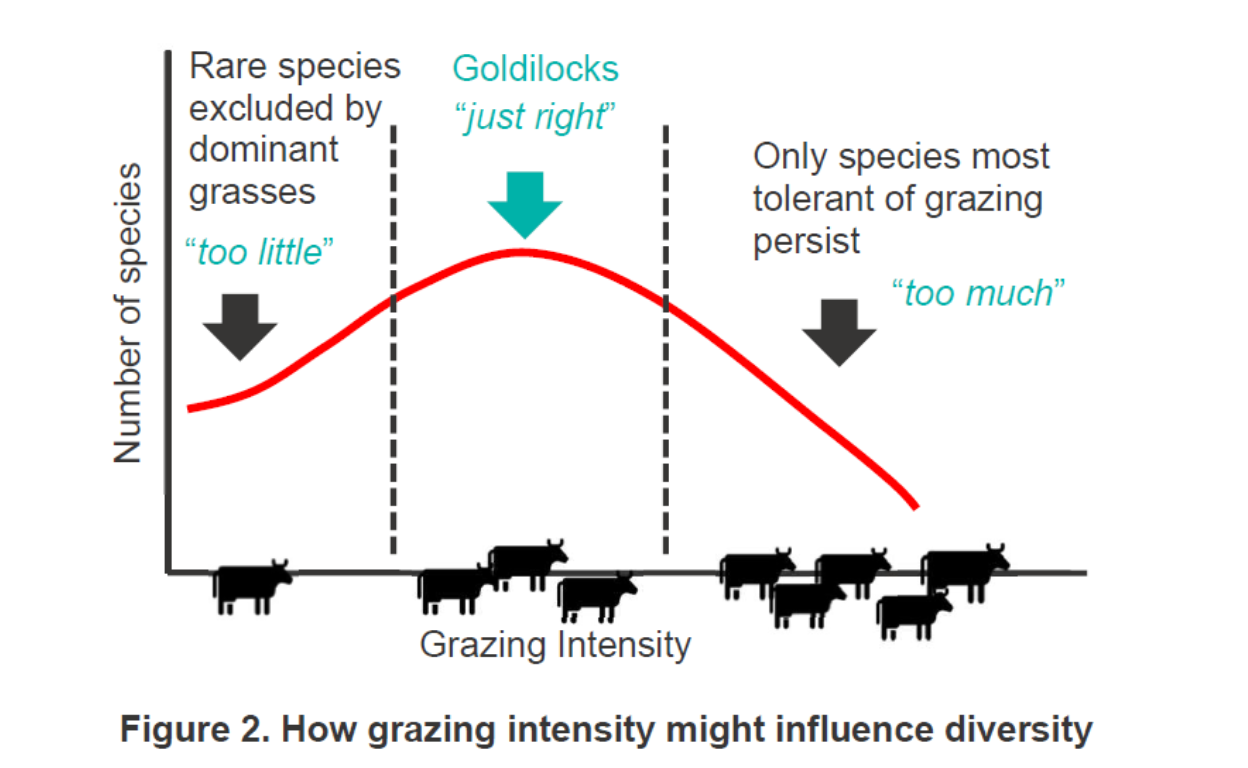
Experimental design
Study sites
Across western and eastern Victoria, a total of 28 sites were selected to be surveyed. These sites were spread across four Catchment Management Authorities (CMA) but with the majority of sites in the western CMAs. Sites were chosen partly to cover a wide variation in grazing intensity and grazing treatment.
Show code
sf_site <- sf::read_sf('data/sf_site.gpkg') %>% select(-transect_id)
# sf_cma <- VicmapR::vicmap_query(layer='open-data-platform:cma100') %>% VicmapR::collect()
sf_cma <- sf::read_sf('data/sf_cma.gpkg')
mapview::mapview(sf_cma, zcol='cmaname', layer.name='cma') +
mapview::mapview(sf_site, zcol='grazing', layer.name='site', col.regions=c('red','blue') )